Keys features of RPi-Monitor
At the beginning RPi-Monitor was designed to run on Raspberry Pi. This is explaining the name of this software. In reality RPi-Monitor can run on every computers running perl.
Since the beginning RPi-Monitor as been designed for embedded devices and performances is the core of development strategy.
The software is divided into two main part:
- A lightweight daemon running on the device and gathering data
- A powerfull WEB application running in browser in charge of data rendering
Collecting metrics
rpimonitordis a daemon wich periodically gather, process and store metrics. In RPi-Monitor metrics are named KPI for Key Performance Indicator.
Storing metrics
Metrics are stored into a Round Robin Database (RRD). This ensure a fixed size for the data storage and keep by default data over 1 year.
Presenting collected metrics
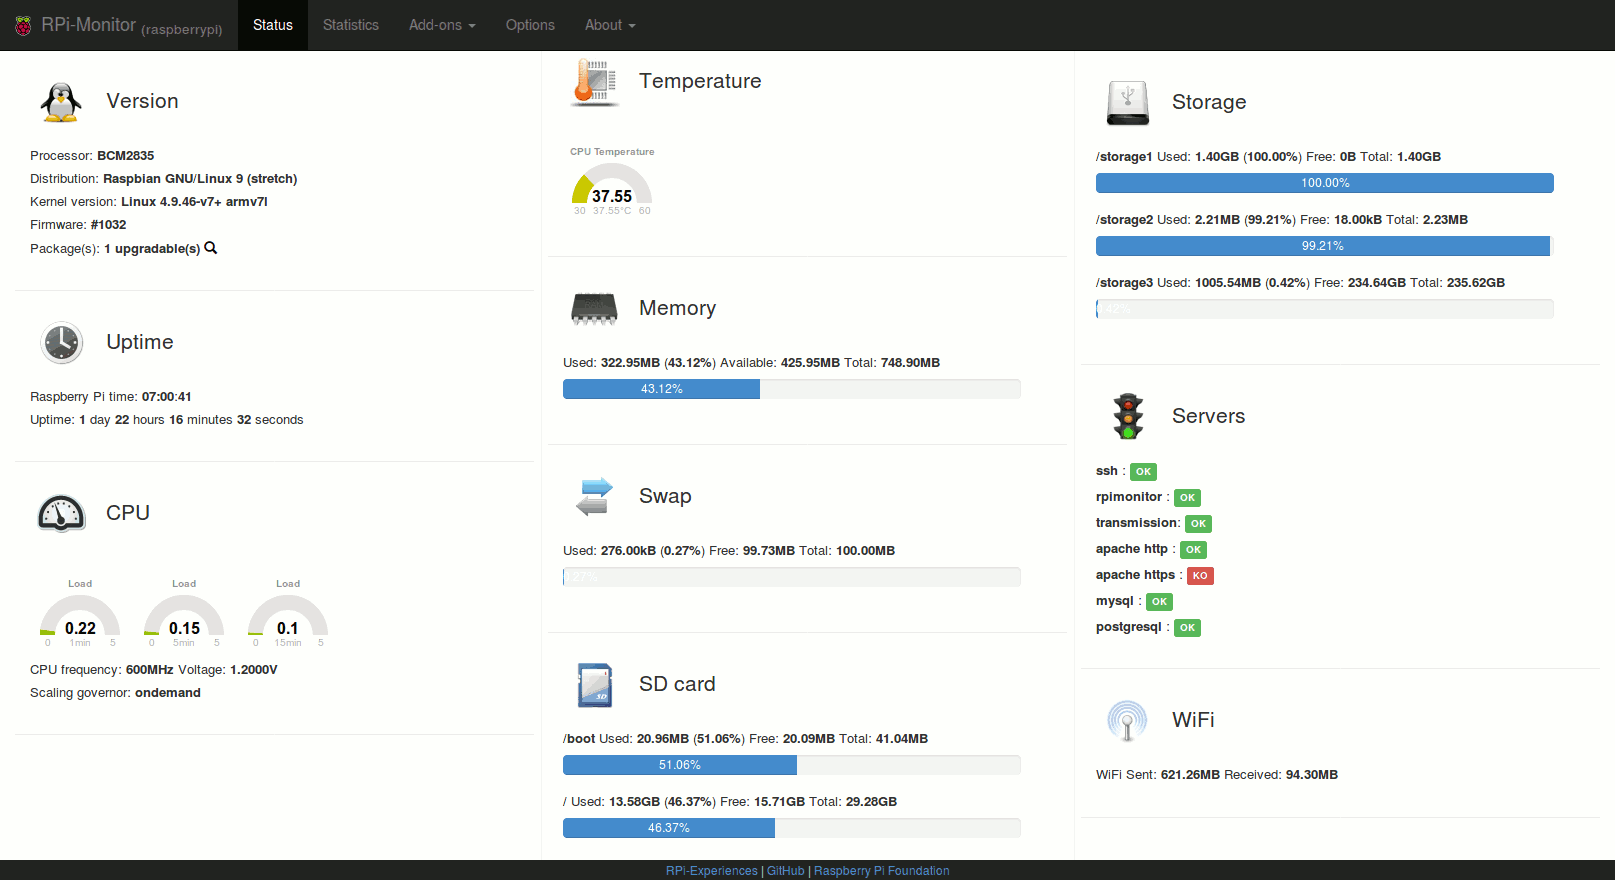
RPi-Monitor embed a web server designed to present collected metrics. Instantaneous data are presented in the status page. Metrics stored in RRD are presented in statistics pages.
The web interface allow user to reorganise status information by drag’n drop.
Statistics page allow to zoom over graph to see details of the mertics.
Embedded web server can be disable and pages can be served by an external web server.
Configurable
In RPi-Monitor everything is configurable:
- Define what metrics to extract and how to extract them
- Define how to store metrics
- Define how to present and share metrics and statistics
- Define how to detect an alert and what to do when alert appears or disappears
- Define ... what you want to do with RPi-Monitor
Processing metrics and raising alerts
RPi-Monitor embed an alert engine fully configurable and able to determine if metrics are out of expected range and raise alerts.
When an alert is detected, RPi-Monitor can execute an action. For example, sending email or SMS.
Definition of critera of alert detection as well as action to perform when alert is detected are fully configurable.
Read only mode
If writing data on disk/eMMC/SSD/SDCard/... is not possible, RPi-Monitor can be executed in read-only mode.
Metrics can be retrived either by web interface in json format or through SNMP.
Sharing metrics
Metrics collected can be downloaded in json format (using the embedded web server), read on disk or remotely accessed through SNMP.
Extending the capabilities
RPi-Monitor is extensible. It provides addons allowing customisation of the interface. For example: Shellinabox or Hawkeye.
RPi-Monitor-Peeble allows to see monitoring status on Peeble smart watch.
RPi-Monitor is also available for Docker and for embedded devices created with Yocto Project