
Configuration using sensors
DHT11 temperature and humidity sensor
Overview
In this chapter we will see how to connect a DHT11 or DHT22 Temperature and Humidity sensor and configure RPi-Monitor to present and draw the outputs.
We will also see how to steup dual-axis.
See also
Adafruit created a very good tutorial explaining how to use DHT11 or DHT22.
This tutorial is available at this here.
Electronic assembly
This electronic assembly is quite simple and will need:
- 1 x DHT11 or 1 x DHT22
- 1 x 4.7k resistor
Plug them as described in the following schema:
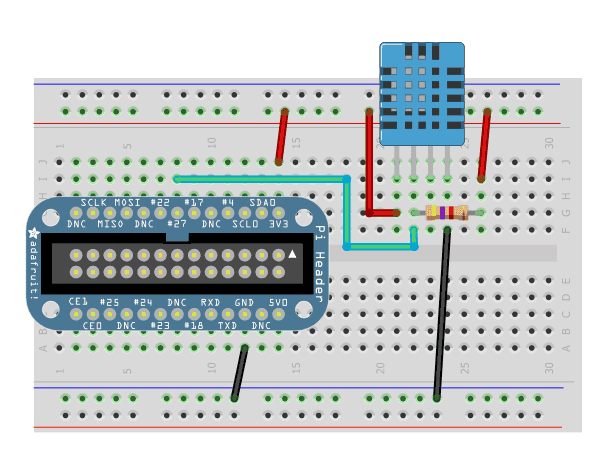
Schema extracted from Adafruit but using GPIO #27 instead of GPIO #4
Software installation
Thanks to Adafruit ( again ;-) ) the installation is quite simple and can be done with two command lines.
Download Adafruit_DHT form Adafruit’s github repository and copy is in /usr/bin as follow:
wget http://goo.gl/oadpl -O Adafruit_DHT
sudo cp Adafruit_DHT /usr/bin/
To test the electronic assembly and the software installation execute the following command (for DHT11):
pi@raspberrypi ~ $ sudo Adafruit_DHT 11 27
Using pin #17Data (40): 0x28 0x0 0x18 0x0 0x40
Temp = 24 *C, Hum = 40 %
You should see the information about temperature and humidity displayed as shown upper.
Note
The DHT11 and DHT22 sensors will only respond every second so if you are not getting data, be sure to wait few seconds before trying again.
RPi-Monitor configuration
Let’s now use this information and add humidity graphs on existing temperature graph.
We first have to extract the data. This is done like this:
dynamic.1.name=humidity
dynamic.1.source=Adafruit_DHT 11 27
dynamic.1.regexp=Hum = (\S+)
dynamic.1.postprocess=
dynamic.1.rrd=GAUGE
We will now add the humidity curve into the graph of temperature. This can be done with the configuration bellow:
web.statistics.1.content.1.title=humidity
web.statistics.1.content.1.ds_graph_options.humidity.label=Humidity (%)
web.statistics.1.content.1.ds_graph_options.humidity.yaxis=2
web.statistics.1.content.1.graph_options.y2axis={ position: "right", min: 0, max: 100 }
As the unit are different than the one existing on the initial axis, we will add a second axis for the percentage of humidity. This is the purpose of the two last lines of the configuration bellow.
The first line is defining the usage of axis number 2 for the humidity.
The last line is defining how this graph should be drawn: On the right, starting from 0 up to 100.
graph_options can have other usefull option. They are described in the
documentation of javascriptrrd.
After restarting RPi-Monotor with the command:
service rpimonitor restart
You will see a new curve in Temperature graph as shown in the screenshot bellow:
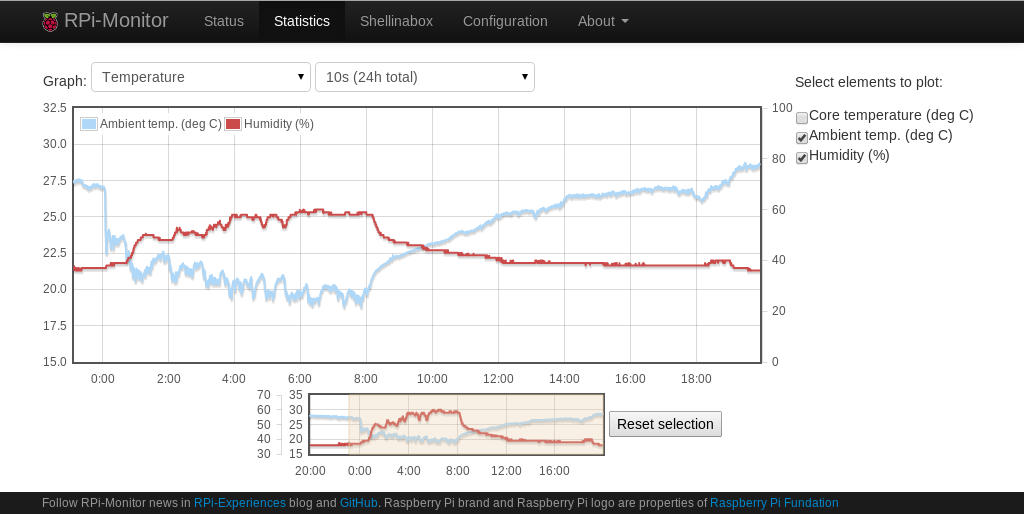
Graph with 2 Y axis: °C in left axis and % humidity (fixed from 0% to 100%) on right axis
DS18B20 1wire temperature sensor
Todo
old conf: to be updated
Add other graphs from additional sources: external temperature probe
Let’s build a little electronic device to measure the room temperature and add this in the temperature graph. Do do that, you will need:
1 x DS18B20 1 x 4.7k resistor
Plug them as described in the following schema extracted from Adafruit Lesson 11:
- Lets first load the kernel module required to get the information from this probe:
- sudo modprobe gpio sudo modprobe w1-gpio sudo modprobe w1-therm
- First we have to identify the id of our probe:
- ls /sys/bus/w1/devices/ 28-000004fe1847 w1_bus_master1
- the id is: 28-000004fe1847. Let’s now check if we can get the temperature:
- cat /sys/bus/w1/devices/28-000004fe1847/w1_slave 5a 01 4b 46 7f ff 06 10 a3 : crc=a3 YES 5a 01 4b 46 7f ff 06 10 a3 t=21625
It looks to work. So now we need to extract the the numbers ending the second line (21625). The regular expression will then be t.(d+)$. I’ll not do a course about what a regexp is there are many site on the internet explaining it. Note: In version 1.x of RPi-Monitor it is prohibited to use = in regular expression.
To add a graph to RPi-Monitor statistic, we need to create a new section. Let’s call it [room_temperature]. Then we have to declare the new data name room_temp, its source /sys/bus/w1/devices/28-000004fe1847/w1_slave and the associated regular expression t.(d+)$. The line to append will look like that:
# Room temperature [room_temperature] room_temp=/sys/bus/w1/devices/28-000004fe1847/w1_slave=t.(d+)$
- Restart RPi-Monitor with the following command and it is done:
- sudo service rpimonitor restart
A new graph is available in statistics (wait a little bit to have data and drawing):
Use zoom feature to see the freshly added data. If you want to add a curve into the Temperature graph, it is possible by adding the KPI line into the section [temperature] as describe bellow:
[temperature] soc_temp=/sys/devices/virtual/thermal/thermal_zone0/temp=(.*) home_temp=/sys/bus/w1/devices/28-000004fe1847/w1_slave=t.(d+)$
- It will then be required to delete the associated rrd file:
- sudo rm /usr/share/rpimonitor/web/stat/temperature.rrd
Restarting RPi-Monitor will regenerate this file with the two describes temperature. After waiting some time to let data to be added, you will have a graph with two temperatures as in the screenshot bellow:
soc_temp and home_temp drawn on the same graph