Web interface configuration
Overview
The presentation of the information is performed by HTML5 pages. These pages dynamically download the information extracted from daemon and perform the rendering the in a nice looking format using:
This architecture has the advantage in an embedded architecture to offload the server task and delegate processing and rendering to the client.
Some data are stored into client browser into local storage.
Note
Embedded server doesn’t provide access control or authentication.
Refer to Authentication and secure access to see how to use nginx to secure RPi-Monitor
The following chapter is explaining how to customize the web interface.
Friends
Friends are defining a displayed title and a link reachable from a
top left menu visible if at least one friends is configured. Each
friend is identified by its <id> and is described by the 2 following
parameters
- web.friends.<id>.title=<display title>
<display title>is the title printed into the drop down menu. This parameter will be evaluated by the javascript command with the functioneval()theirfore parameter should be valid javacript.- web.friends.<id>.link=<link to RPi-Monitor>
<link to RPi-Monitor>is the link to another RPi-Monitor running into the friend machine.
See also
Example of implementation in Friends customisation example
Header customisation
Header of web page can be customized with the following parameters:
- web.page.icon=<icon location relative to webroot>
<icon location relative to webroot>is the path and filename of the icon to be displayed into RPi-Monitor title bar- web.page.menutitle=<menu title>
<menu title>javascript code defining the text displayed into RPi-Monotor title bar. This code can use status information with the keyworddataincluding thedata.hostnameavailable natively- web.page.pagetitle=<page title>
<page title>javascript code defining the text displayed into tab and window title bar. This code can use status information with the keyworddataincluding thedata.hostnameavailable natively
Status
The status page is fully configurable. It is possible to define multiple pages.
Each page is identified by its <page id>.
See also
Example of implementation in Multi-pages customisation example
- web.status.<page id>.title=<page title>
<page title>title of the page displayed into the drop down menu in case of multiple pages. This parameter will be evaluated by the javascript command with the functioneval()theirfore parameter should be valid javacript.Hint
You can use the function
LinkToGraph(page,graph,text)direct link to graph.
Status page is split in strips displaying information. Each status strip is
identified by a unique <status id>. Each status strip is defined by a title,
an icon and a serie of parameters described as follow:
- web.status.<page id>.content.<status id>.visibility=<visibility formula>
<visibility formula>should be a valid javascript formula returning0: to hide the row anything else but0: show the rowSee also
Example of implementation in Visibility example
- web.status.<page id>.content.<status id>.title=<display title>
<display title>title displayed as title of the strip- web.status.<page id>.content.<status id>.icon=<display icon>
<display icon>Icon of the strip- web.status.<page id>.content.<status id>.line.<line number>=<parameter>
<line number>represent the position of the line within the strip.This number has to be unique within the strip.
<parameter>is describing the content of the line. This parameter will be evaluated by the javascript command with the functioneval()theirfore parameter should be valid javacript.To have clean rendering, RPi-Monitor web interface provides some functions that could be used inside the parameter. The object
datais also available and contains the result ofdynamicandstaticextracted as described in the KPI extraction section (Ex:data.version).Functions provided by RPi-Monitor are the following:
- Uptime(uptime in sec)
Print the uptime from seconds to the following format: XX year XX days XX hours XX minutes XX seconds
- Pad(value)
Add a prefixed 0 for number smaller than 10
- KMG(value, prefix)
Print value in kilo, Mega, Giga, Peta. prefix can be ‘k’, ‘M’, ‘G’ or ‘P’ depending on the value.
- Percent(value,total)
Print percentage of value compared to total
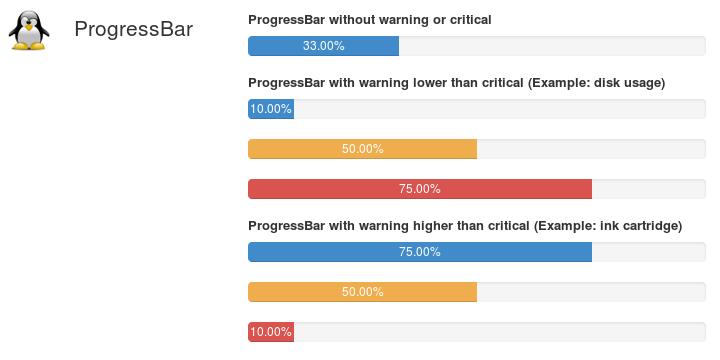
- ProgressBar(value,total,warning, danger)
Draw a progressbar representing the value compared to total.
The default color of pregressbar is blue.
If warning value is lower than critical, progressbar color will be orange if percentage is higher than warning value and red if the percentage is higher than danger value.
If warning value is higher than critical, progressbar color will be orange if percentage is lower than warning value and red if the percentage is lower than danger value.
- JustGageBar(title, label,min, value, max, width, height, levelColors, warning, critical)
Draw a half-circular gauge
- title : Title of the gauge (located on to of the gauge)
- label : Label of the gauge (located under the value)
- min : min value of the gauge
- value : value to be drawn
- max : max value of the gauge
- width, height : size of the gauge
- levelColors : Array defining colors of each level [normal,warning,critical] (in Hex format), default: green, orange and red. Default colors are available into the array
percentColors. - warning : Warning level (in %) used to define color (default: 33)
- critical : Critical level (in %) used to define color (default: 66)

- Plural(value)
Print ‘s ‘ if value > 1 or ‘ ‘ if not.
- Clock(data.localtime)
This function is a little bit particular and should be written exactly as in the upper line. It will display on screen the current time and will simulate the seconds by incrementing them periodically.
Label(data,formula, text, level)
- Badge(data,formula, text, level)
This function write a label/badge with a defined background color if the formula return TRUE.
- data : data to use with the formula
- formula : formula evaluated in regards to data to determine if label/badge has to be printed
- text : text to be displayed
- level : ‘default’ (grey), ‘primary’ (blue label/grey badge), ‘success’ (green), ‘info’ (cyan), ‘warning’ (orange), ‘danger’ (red)

- InsertHTML(url)
This function is used to insert an HTML information inside a page.
See also
Example of implementation in Top3 addon
- LinkToGraph(page,graph,text)
This function is used create a link to graph in specific page.
- page : page id (starting from 0)
- graph : graph id (starting from 0)
- text : text of the link
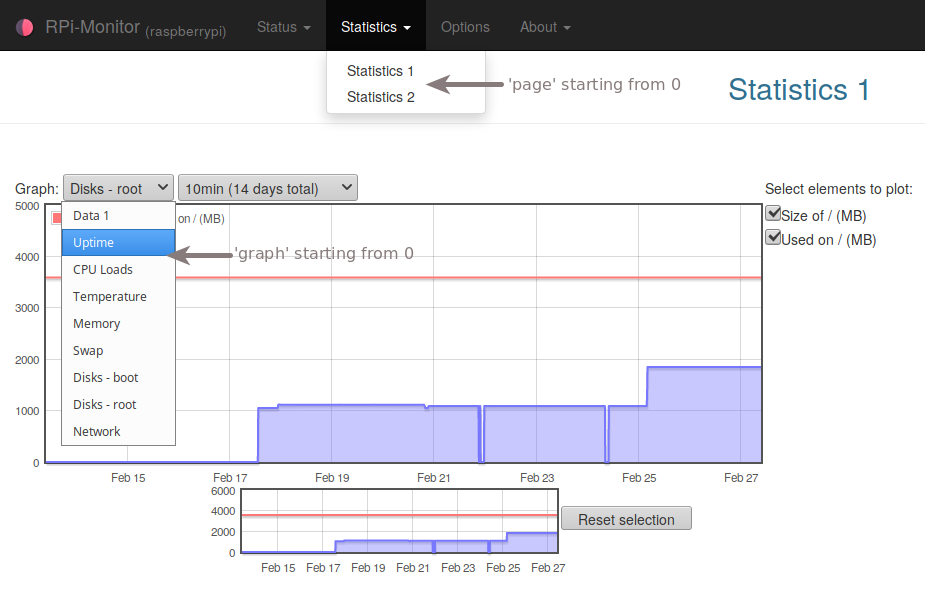
Statistics
The statistic page is fully configurable.
It is possible to define multiple pages. Each page is identified by
its <page id>.
- web.statistic.<page id>.title=<page title>
<page title>title of the page displayed into the drop down menu in case of multiple pages. This parameter will be evaluated by the javascript command with the functioneval()theirfore parameter should be valid javacript.
The statistic page displays statistics graphs. The graphs are
identified an unique <statistic id> and by the following parameters.
- web.statistics.<page id>.content.<statistic id>.title=<statistic title>
<statistic title>is the title of the statistics displayed in the top left drop down list.- web.statistics.<page id>.content.<statistic id>.graph.<rrd id>=<data name>
<rrd id>is identifying the graph and is unique per<statistic id><data name>is the name of the dynamic and static extracted as described in the KPI extraction section.- web.statistics.<page id>.content.<statistic id>.ds_graph_options.<data name>.label=<label>
<data name>same as the previous<data name><label>Label to display in legends. It is possible to setup other parameters of ds_graph_options. Refer to javascriptrrd documentation for details.- web.statistics.<page id>.content.<statistic id>.graph_options.<parameter>=<value>
<parameter>and<value>can be find into the same web page as previous parameter. This allow to customize the graph and axis.
Addons
RPi-Monitor features can be extended by addons. Addons are
html,javascriptandcsscode installed in/usr/share/rpimonitor/web/addons/.Each addons is idendifier by an
idand the following parameters:
- web.addons.<id>.title=<title to be display>
<title to be display>defines the text display in RPi-Monitor web interface. This parameter will be evaluated by the javascript command with the functioneval()theirfore parameter should be valid javacript.- web.addons.<id>.addons=<addon name>
<addon name>defines the addon to activate.- web.addons.<id>.showTitle=<0|1>
<0|1>defines it the title of addon has to be shown in addon page.- web.addons.<id>.<parameter>=<value>
<parameter>=<value>are optional parameter to configure addonSee also
Example of addons in addons configuration